
DNAPL mapping using big data
A chemical industry located in the state of São Paulo retained GEOKLOCK to conduct the probabilistic mapping of DNAPL occurrence, aimed at the obtaining following results:
- Estimation of the total mass of contamination, including uncertainty calculations;
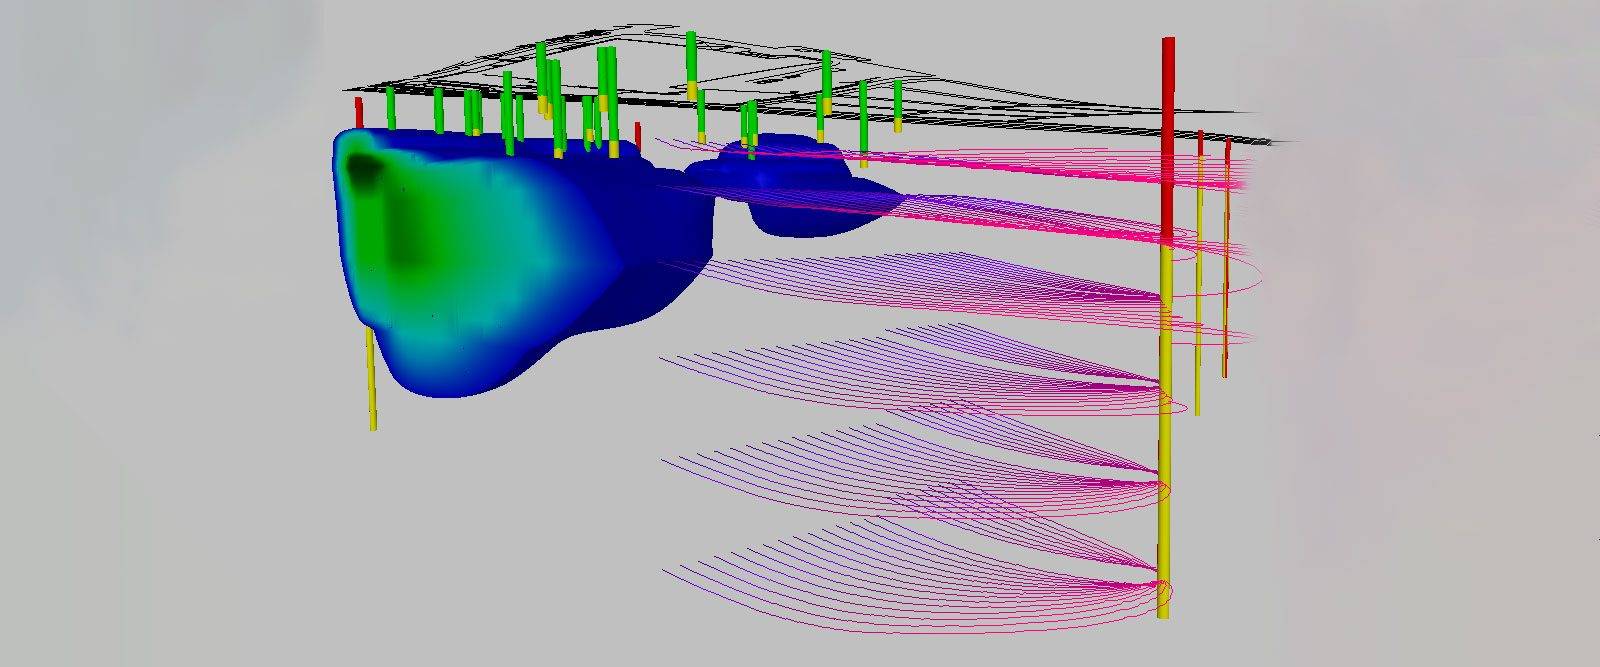
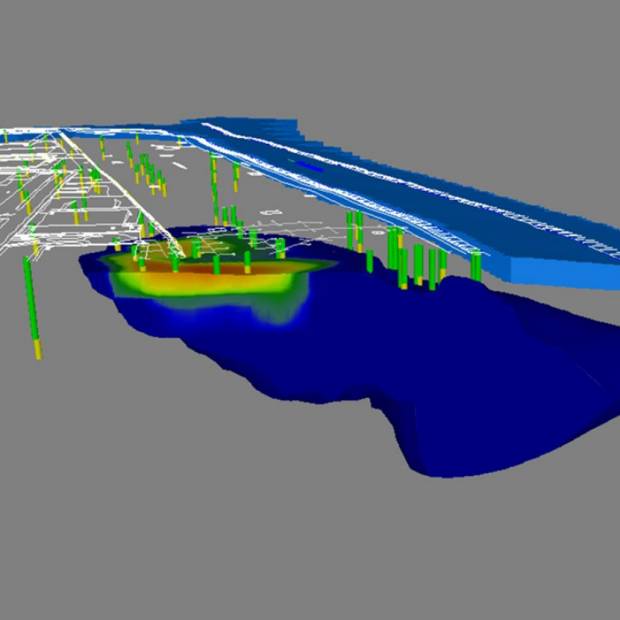
- 3D delineation of the volume of contamination (vadose zone and saturated zone), including uncertainty calculations;
- Production of maps of potential target areas for remediation, including an estimate of the likelihood of successful interventions.
The field efforts, which lasted approximately 1.5 month, encompassed the advancement of 59 high-resolution membrane interface probes (MIP) and the collection of 140 soil samples for laboratory analyses, both from the vadose zone and from the saturated zone.
These efforts generated over 500,000 georeferenced data, which were inputted into an EQuIS® environmental database. This extensive database supported an exploratory statistical analysis to correlate the lab results with the readings obtained using the high-resolution tool.
The correlations found (particularly between the lab results for VOCs and the MIP’s PID sensor) allowed the adoption of binary indicators, as follows:
- 1 (one) was applied to data typical of DNAPL presence (based on calculations of saturation in soil samples);
- 0 (zero) was attributed to data non-characteristic of DNAPL occurrence.
The binary indicators were used for stochastic simulations through the application of the sequential simulation algorithm [algoritmo de “Simulação Sequencial da Indicatriz”] available in the SGeMS program.
The 30 equiprobable scenarios allowed the estimation of the likelihood of DNAPL occurrence in each of the 307,572 blocks of the simulation grid adopted. This enabled the preparation of 3D probabilistic maps.
The results suggested a DNAPL-impacted volume of soil in the magnitude of 25,000 m3, with the total mass of DNAPL estimated at 200 tonnes. This was calculated for a probability equal or greater than 75%.
The final product of the project provided an important tool for the rational allocation of resources, since it enabled the mathematical definition of priority targets.
Within a wider scope, the work created a feasible solution for the combination of high-resolution semi-quantitative data and discrete quantitative data.


